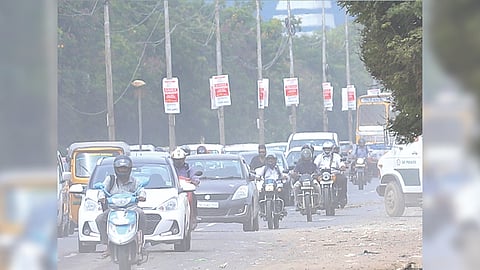

CHENNAI: With the ambient air quality in Chennai worsening in 2022 and the metropolis losing its vaunted position in the least polluted big cities, the Tamil Nadu Pollution Control Board (TNPCB) and the Greater Chennai Corporation have decided to study the source of pollution, and the type, time and other details of the pollutants, and assess the carrying capacity of the city.
The study would be done by the IIT-Madras under the National Clean Air Programme (NCAP).
The TNPCB said 20 hotspots have been identified to conduct the study during summer and winter seasons. These include Tiruvottiyur, Manali, Anna Nagar, Nungambakkam, T Nagar, Ambattur, Besant Nagar and Meenambakkam among others. The levels have already been collected from some locations.
Under the source apportionment and emission inventory study, analysis of PM10, PM2.5, nitrogen dioxide (NO2) and sulphur dioxide (SO2) during both the seasons will be carried out. Apart from this, carrying capacity for the city using a suitable dispersion model will also be studied.
In layman’s terms, source apportionment study is conducted to identify the sources of pollutants and extent of their contribution in worsening the air quality; emission inventory would study the type of pollutants, the time when they are released and other details; and carrying capacity would assess the growth limits an area can accommodate without violating environmental capacity goals.
Data shows that average PM10 and PM2.5 levels in Chennai are increasing. In 2022, the city recorded an increase in average PM2.5 level to 28 micrograms per cubic metre of air, from 25 micrograms in 2021. Similarly, the PM10 level in 2021-22 was 52 micrograms per cubic metre, from 50 micrograms in 2020-21.
The National Ambient Air Quality Standards (NAAQS) for PM2.5 and PM10 are 40 micrograms and 60 micrograms, respectively. On the brighter side, NO2 and SO2 levels are well within the prescribed limits.
Visit news.dtnext.in to explore our interactive epaper!
Download the DT Next app for more exciting features!
Click here for iOS
Click here for Android