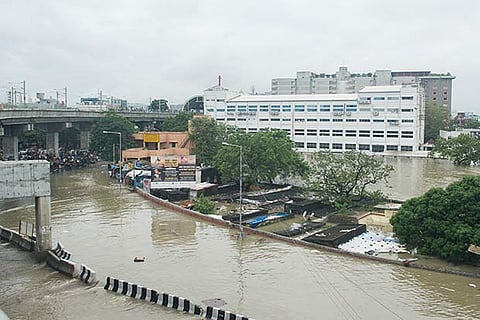

Chennai
In 2006, Care Earth Trust undertook a study on Flood Risk Assessment of the city of Chennai, in collaboration with the University of Freiburg, Germany. One of the many fascinating components of the study was the history of monsoons and precipitation of the city. Based on precipitation data dating back to 1813, a trend analysis was carried out which revealed the occurrence of decadal mid-term fluctuations (both wet and dry) as also single, extreme dry and wet years, which dramatically exceeded the overall fluctuations of the rainfall pattern. While the residents of the city continue to dread the unusual rain, the researchers declared the overall structure of the precipitation of the city as stationary! This is because, only 9 extreme rainfall events have been recorded for Chennai, post 1813 by the international Flood Observatories. This certainly reiterates the importance of having a Chennai city Observatory that could be more grounded and connected to local vagaries of climate and resultant impacts.
Yet another significant result of the study was what was termed as the derivation of transfer function, which essentially captures the relationship between rainfall and the wetland area within Chennai. Evidently, this was stated to be compromised rather severely, and the newer habitations of the city even during a normal rainfall year were designated as being vulnerable to water logging and flash floods.
Why were the old habitations being excluded ? What metrics did our fishing and farming communities use to identify areas not prone to water logging, are questions that remain unstudied. What is known, albeit to a very small group of people, is that the British Surveyors embarked on an elevation mapping of the city through the Great Trigonometric Survey (GTS). The first benchmark was erected on St. Thomas Mount, and the triangulation was completed with benchmarks on the Perumbakkam and Nanmangalam hills. This formed the basis for ascertaining the elevation of the area above the Mean Sea Level by taking check levels from the nearest GTS benchmark. Designation of land for various forms of use was based on the GTS.—in simple words, smart land use planning. While we have been able to locate the bench mark on the Nanmangalam hills which is today a Reserve Forest, one is left wondering if the benchmarks on the other hills, as also in other parts of the city exist.
—Jayshree Vencatesan, Managing Trustee, and S Thirunavakarasu (Project Advisor) Care Earth Trust
Visit news.dtnext.in to explore our interactive epaper!
Download the DT Next app for more exciting features!
Click here for iOS
Click here for Android